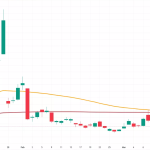
Silver has entered a consolidation phase after a recent period of sharp volatility. The charts suggest that the market is balanced in the short term, with neither buyers nor sellers clearly in control. Price remains trapped in a tight range, while momentum indicators show fading strength after the previous upside attempt.
The metal continues to trade near the $62.20 to $62.40 area, with the market trying to find direction after a recovery move. The technical structure suggests price compression, a pattern that often comes before volatility expansion. However, the direction of the next breakout is still unclear.
For traders, the key levels are now well defined: a recovery above $62.40 to $62.50 could signal short-term strength, while a loss of the $62.20 area could open the door to renewed selling pressure.
Silver Trades in a Tight Intraday Range
On the 5-minute chart, silver has been consolidating through a sequence of short moves inside the $62.20 to $62.40 range. Price appears to have found equilibrium near $62.30, reflecting the lack of directional conviction in the market.
This tight range shows that buyers and sellers are reacting at nearby levels. Buyers have defended the lower area around $62.20, preventing deeper declines so far. At the same time, recovery attempts toward $62.40 have faced rejection.
This creates a sideways market. Silver is not showing enough strength to break higher, but it has also not lost support decisively. As long as this dynamic continues, the metal may remain trapped inside a narrow technical range.
The $62.20 Area Acts as Immediate Support
The $62.20 level has become the most important short-term support. Each time price approaches that area, there are signs of buyer absorption.
This reaction suggests that short-term demand exists near that level. However, support that is tested repeatedly can weaken if buyers fail to produce a stronger rebound.
A clear break below $62.20 could change the technical reading. In that case, price could move toward lower liquidity areas below the current range, opening space for a broader correction.
For now, support remains valid, but the inability to sustain a move above $62.40 keeps the market in a neutral position.
$62.40 Remains Short-Term Resistance
Immediate resistance sits around $62.40. The chart shows several attempts to reclaim this level, but each has struggled.
These repeated rejections indicate that sellers or profit-takers appear whenever price attempts to rise. The resistance is not necessarily strong enough to trigger a deep decline, but it has been enough to prevent a clear return to upside momentum.
To improve the technical structure, silver would need to break above $62.40 and sustain trading above that area. A firmer move above $62.50 would reinforce the case for positive continuation.
Without that breakout, the market will continue to treat the recovery as incomplete.
Momentum Fades After the Initial Advance
On the 30-minute chart, silver still preserves part of its earlier recovery, but momentum is showing signs of weakening. The MACD is approaching the zero line, indicating that buying pressure from the previous impulse is fading.
The histogram bars have also narrowed, suggesting lower volatility and less intensity in the move. This type of behavior is common after a fast rally, when the market needs to consolidate before defining a new direction.
The loss of momentum does not automatically mean a bearish reversal. It only shows that the strength of the initial advance is no longer expanding.
For the outlook to turn more positive again, the MACD would need to move higher once more, supported by a resistance breakout and stronger volume.
RSI Confirms the Neutral Reading
The RSI remains in the mid-50 area. This position indicates that the market is neither overbought nor oversold.
When RSI sits in the middle of its range, it confirms the absence of dominant pressure. Buyers are not strong enough to push the indicator into higher zones, while sellers are also unable to drive it into oversold territory.
This reading matches the sideways price action. Silver is in technical balance, waiting for a new catalyst.
An RSI rise toward 60 or 65, combined with a breakout above $62.50, could signal improving momentum. On the other hand, an RSI drop below 45 alongside a support break could strengthen a correction scenario.
Price Compression May Precede Volatility Expansion
The narrowing range suggests price compression. In technical analysis, compression periods often come before larger moves because the market builds energy while buyers and sellers fight for direction.
When the range finally breaks, the move can accelerate. This happens because traders positioned on the wrong side may be forced to adjust, while new participants enter in the direction of the breakout.
In silver’s case, the current compression follows a volatile move. That increases the importance of nearby technical levels.
The $62.40 to $62.50 zone is the upper trigger. The $62.20 region is the lower boundary. A decisive break on either side could define the next short-term move.
Larger Structure Still Shows an Incomplete Recovery
The larger-scale chart shows that silver found support after an earlier selloff and attempted to build a steady recovery. However, that recovery has still not produced a clear sequence of higher highs.
This detail matters. To confirm a more consistent uptrend, the metal would need to break resistance and form a structure of rising highs and rising lows.
So far, silver has recovered, but it has failed to establish buyer dominance. This keeps the market in an indecision phase.
The consolidation may be healthy if it prepares the next upside leg. But it could also turn into distribution if price loses support and returns to recent lows.
Traders Watch the $62.40-$62.50 Zone
The $62.40 to $62.50 zone is the key area for buyers to watch. A sustained breakout above this range would indicate that short-term selling pressure has been absorbed.
Such a move could attract new buyers and encourage technical traders to look for upside continuation. Silver could then attempt to move toward higher levels, depending on volume strength and the behavior of the dollar, interest rates and precious metals more broadly.
However, the breakout must be sustained. A quick move above $62.50 followed by rejection could become a false breakout and create renewed selling pressure.
For that reason, a close above resistance and the ability to hold above the range matter more than a brief intraday spike.
Loss of Support Could Reactivate Recent Lows
On the downside, a clear loss of $62.20 would change the short-term structure. That move would indicate that buyers are no longer defending immediate support.
In that scenario, silver could revisit areas tested earlier in the week, where liquidity and buyer interest had previously appeared. A return to those regions could represent a technical correction, especially if it comes with a falling RSI and weakening MACD.
A support break could also increase volatility, as traders who bought inside the current range may close positions.
For now, this scenario has not been confirmed. But it remains the main technical risk.
Silver Still Has No Clear Direction
The most important point in the current analysis is that silver has no clear short-term direction. Price is stable, momentum has slowed, and technical indicators are neutral.
This kind of environment requires caution. Buying in the middle of the range may offer limited reward relative to risk, while selling before support breaks may also be premature.
Short-term traders will likely wait for confirmation. That confirmation could come through a breakout above $62.50 or a break below $62.20.
Until then, the dominant reading is consolidation.
External Factors Can Also Influence the Next Move
Although the current analysis is technical, silver can also react to macroeconomic factors. The metal is sensitive to the dollar, Treasury yields, interest-rate expectations, industrial demand and gold’s behavior.
If the dollar weakens or yields fall, silver could receive additional support. If the dollar strengthens and real rates rise, the metal could face more pressure.
Changes in precious metals sentiment can also affect the move. Silver often behaves more volatilely than gold because it combines characteristics of a monetary asset and an industrial metal.
For that reason, a technical breakout could gain strength if it is accompanied by a macro catalyst.
Silver is consolidating after a volatile move, trading in a tight range between $62.20 and $62.40, with temporary equilibrium near $62.30. Immediate support sits at $62.20, while short-term resistance remains between $62.40 and $62.50.
Technical indicators reinforce the neutral reading. The MACD has lost strength after the initial impulse, and the RSI remains in the middle zone, with no overbought or oversold signal. Price compression suggests that a stronger move may be approaching, but direction still depends on confirmation.
Silver is in a technical waiting phase. Buyers need to break and hold prices above $62.40 to $62.50 to recover momentum. Sellers need to break $62.20 to confirm renewed downside pressure. Until one of these levels breaks, the market remains neutral, compressed and vulnerable to volatility expansion.